

There’s no doubt that Google Analytics is an essential tool to utilize in your online marketing strategy. However, the data you get from Google Analytics aren’t always accurate, nor are they always actionable. To get the most out of it, the tool demands customization and refinement to make the data work for you. This kind of approach allows you to gather the data in a way that the report you get really is something you can benefit from.
 Detecting spam by hostname is even more effective. A hostname is basically your website, from which you’re tracking traffic with your unique Google Analytics code. It can be with or without www. Other hostnames are most commonly spam because you don’t have a tracking code installed on those websites.
 Using custom filter type, you get access to much more options, including filtering by campaign or e-commerce source, by location, application, etc.
While these additional filters are helpful for segmenting the data and they provide a lot of opportunities for filtering traffic to monitor different activities such as paid advertising performance, predefined filters are quite enough for dealing with spammers. Simply choose the suitable option and exclude any spam related domains or hostnames.
Using custom filter type, you get access to much more options, including filtering by campaign or e-commerce source, by location, application, etc.
While these additional filters are helpful for segmenting the data and they provide a lot of opportunities for filtering traffic to monitor different activities such as paid advertising performance, predefined filters are quite enough for dealing with spammers. Simply choose the suitable option and exclude any spam related domains or hostnames.
 Besides monitoring performance and tracking actions of interest, goals can be very helpful with understanding your website and how the users interact with it. For example, you could use Goal URLs option to find the pages that lead to your goal.
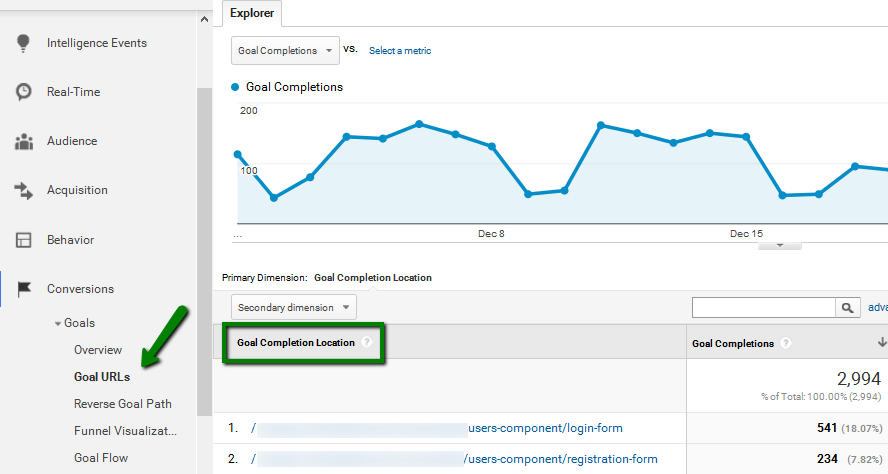 This way you can detect pages that convert the most and try to optimize other pages in the same way, in order to maximize conversion rate throughout your website.
To set up a goal, go to the Admin tab, choose the view you want to set up a goal for and click on New Goal.
This way you can detect pages that convert the most and try to optimize other pages in the same way, in order to maximize conversion rate throughout your website.
To set up a goal, go to the Admin tab, choose the view you want to set up a goal for and click on New Goal.
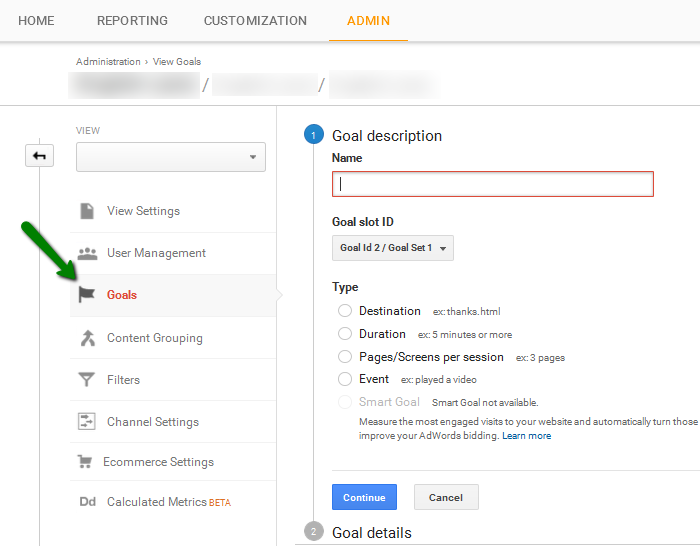 When you have the goal active, it will collect the data and show the stats related to a percentage of goal completion, as well as the goal value if you added a monetary value when setting up the goal.
Other things to have in mind:
When you have the goal active, it will collect the data and show the stats related to a percentage of goal completion, as well as the goal value if you added a monetary value when setting up the goal.
Other things to have in mind:
 For example, you might notice a sudden increase in traffic around New Year, which means this could be a perfect time to start a campaign to get new subscribers, to increase sales, etc. On the other hand, you might notice a particularly low performance last month in comparison to the previous period, which might be caused by a new website design, which obviously isn’t working out for you.
Set up filters
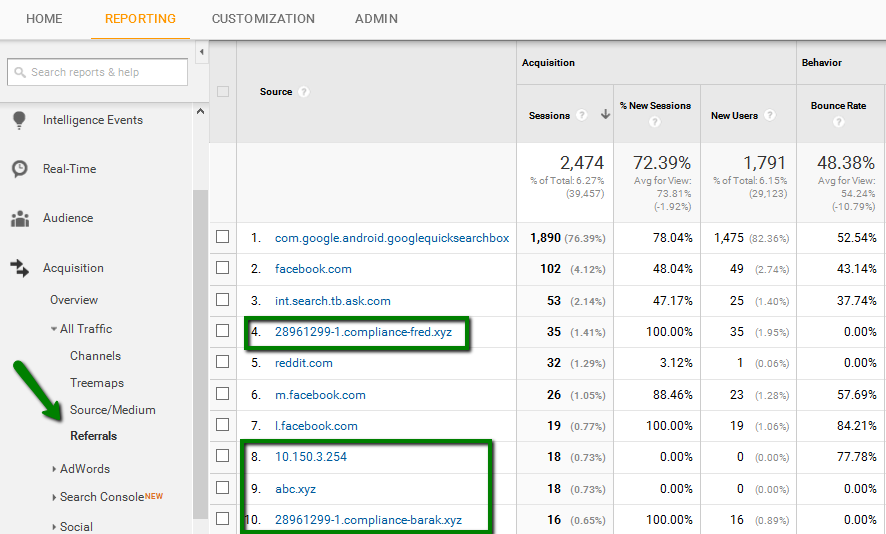
If you want to get accurate data from Google Analytics, you need to use filters. Recently, Google Analytics has been a target of many referrer spam attacks that have been wrecking the data. As much as you love seeing a sudden spike in traffic, you’ll need to make sure that it’s genuine and that you’re not just being targeted by one of those spammers. If your site was under such an attack, it’s recommended that you use filters to filter out all irrelevant traffic and keep only the data that truly helps you assess the website performance.Step 1: Detect spam
In order to fight spam, you need to detect it in your report. Go to your Google Analytics account, under Reporting tab, check Acquisition. Find the option All Traffic and click on Referrals, and here you’ll see the list of domains that supposedly link to your website. You might notice some unusual referral domains in this section, and those will usually have lots of sessions listed but zero users or they will have both sessions and users but the bounce rate will be zero. Don’t click on those links because they may contain viruses. Here’s the list of so far known ghost referrers.
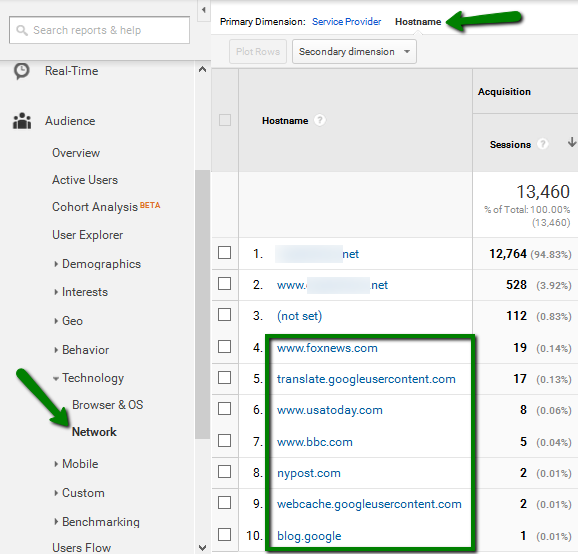
Detecting spam by hostname is even more effective. A hostname is basically your website, from which you’re tracking traffic with your unique Google Analytics code. It can be with or without www. Other hostnames are most commonly spam because you don’t have a tracking code installed on those websites.
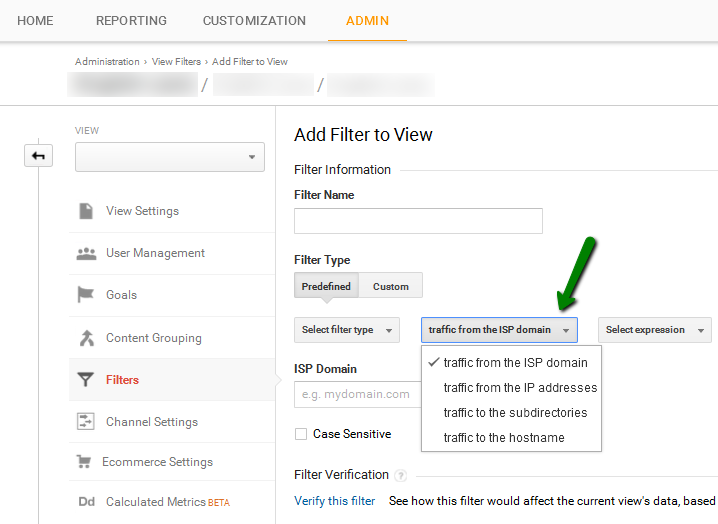
Step 2: Create a filter
There are two ways to create filters. Use predefined options to exclude or include the ISP domain, IP addresses, subdirectories, and hostnames.
Using custom filter type, you get access to much more options, including filtering by campaign or e-commerce source, by location, application, etc.
While these additional filters are helpful for segmenting the data and they provide a lot of opportunities for filtering traffic to monitor different activities such as paid advertising performance, predefined filters are quite enough for dealing with spammers. Simply choose the suitable option and exclude any spam related domains or hostnames.
Step 3: Monitor
Although filters help with blocking unwanted traffic sources, spammers are constantly changing tactics and strategies, allowing them to get through and keep messing with the data, which is why you need to frequently monitor the traffic and filters. A couple of things to have in mind:- Always have an unfiltered view, to retain access to the full scale of data.
- Filters remove spam from that point onwards, the past data remains the same.
- Filters remove traffic forever from your analytics, so they have to be setup with lots of care, as you don’t want to risk losing valuable data.
Create custom goals
Goals are a perfect way to use Google Analytics to monitor specific activities. You’ll need to provide information about the actions that you want to track as a goal, regardless if that is a visit to a specific page, an event, a visit duration, etc. Tracking the activity of interest is going to help with analyzing your strategy and taking necessary actions. For example, visiting a landing page leads to a sale in 50% of cases, so your goal would be to monitor these visits closely to find out channels and referrals that are helping you achieve your goals the most. Adding a monetary value will help with calculating the performance and planning the budget for the future period.
Besides monitoring performance and tracking actions of interest, goals can be very helpful with understanding your website and how the users interact with it. For example, you could use Goal URLs option to find the pages that lead to your goal.
This way you can detect pages that convert the most and try to optimize other pages in the same way, in order to maximize conversion rate throughout your website.
To set up a goal, go to the Admin tab, choose the view you want to set up a goal for and click on New Goal.
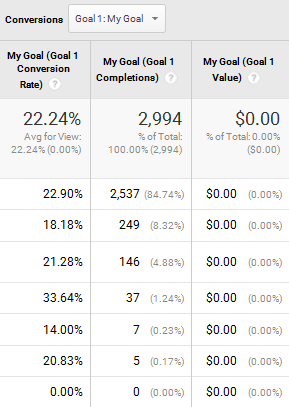
When you have the goal active, it will collect the data and show the stats related to a percentage of goal completion, as well as the goal value if you added a monetary value when setting up the goal.
Other things to have in mind:
- You can create 20 goals per view.
- Goal collects the data during the time it’s active, no past data are included.
Keep an eye on mobile stats
As the usage of mobile devices is overtaking the share in overall traffic, mobile marketing started to have an important role in website performance, thus affecting website traffic and statistics as well. To check mobile traffic in Google Analytics, go to Audience, Mobile and find the option Overview. Choose the time period for which you want to analyze the data and take a look at the charts. Mobile statistics have several benefits:- They show the share of mobile traffic in relation to total traffic from all the sources – If you notice that you’re getting an increasingly large amount of traffic from mobile, you need to make sure that your website is mobile-friendly, and that you’re doing your best to keep and convert those visitors.
- A sign of a good or poor mobile optimization – Other metrics, such as bounce rate and average session duration can also be indicators of how optimized your website is in terms of mobile traffic.
- Goal completion rate – The data will show you whether mobile visits result in larger or smaller goal completion rate in comparison to the visits coming from a desktop. The goal completion rate is another indicator of accessibility through mobile devices.
- Opportunities for mobile advertising – With these stats, you might discover that mobile advertising has a potential you haven’t been aware of, which might additionally help you expand your reach.
Use a custom dashboard
Google Analytics offers a lot of data about website performance, but you might not be interested in tracking everything. The tool comes with a universal dashboard with the full list of options available in the menu on the left. To avoid scrolling back and forth through these options every time you log in, it’s best you create a custom dashboard. When designing your own dashboard, all of the widgets are available, so you should include those you monitor the most. This way, you’ll have everything at a glance, making your daily monitoring quick and easy. Use the option Dashboards at the top, click on +New Dashboard and simply customize it in the way that it presents all the data you want to monitor regularly.Segment your audience
To learn more about your target audience, use segmentation option. If finding more about the visitors and comparing demographics stats with goals and conversion is something your business will benefit from, this option is a perfect way to go. This is also helpful for websites that have several groups of a target audience. Segmentation is actually the process of isolating a certain group, based on age, gender, language, country, etc. Segmenting the group based on certain criteria allows you to analyze the performance in relation to this criteria. For example, visitors from 18-24 are usually referred from social media. A certain landing page is mostly popular among those using a desktop for browsing. Leverage this knowledge by improving your website to boost or reduce a certain action in a specific group. By analyzing the audience, you might get to discover new opportunities for improvements among a specific target group. Segments use filters to divide the data, but don’t alter the data in the Analytics. They only isolate and analyze a specific group of users, such as sessions originating from a particular campaign, those who previously purchased from you, etc. Things to consider regarding segmentation:- You can have up to 4 segments applied to your reports at any one time.
- User-based segments can be monitored within 90-day range.
Learn more about site search
To find out more about what visitors are searching for on your website, take advantage of this option in Google Analytics. From the left menu, click on Behavior, Site Search and then choose the specific option you want to analyze. This option helps you:- Understand your visitors better by learning about their needs
- Get new content ideas, because you might discover topics you haven’t yet covered
- Find out what topic or question is the most popular among your target group
Use annotations to keep track of changes
This feature of Google Analytics is a very helpful option to keep track of changes, and then explore how those affect website statistics. Any action that might affect traffic and stats, such as creating a filter, sending a newsletter, getting your blog post shared by an influential magazine, etc. should be accompanied with an annotation of when the action happened. To create an annotation, use a button available below the graph. Choose the date, add the description and save the annotation in the report.Keep comparing website performance
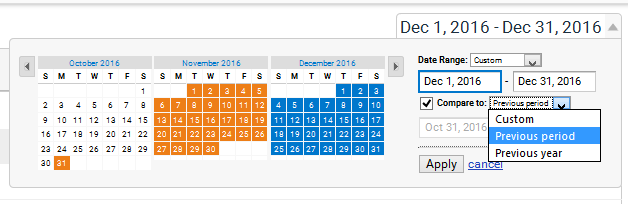
Website performance fluctuates. This can be caused by many factors including a specific time of the year, new competitors reaching the market, the frequency of publishing new content, etc. The benefit of this tool is that you can compare website performance in different time periods, to detect how these factors influence the performance. This allows you to predict and prepare yourself for the periods of fluctuations.
For example, you might notice a sudden increase in traffic around New Year, which means this could be a perfect time to start a campaign to get new subscribers, to increase sales, etc. On the other hand, you might notice a particularly low performance last month in comparison to the previous period, which might be caused by a new website design, which obviously isn’t working out for you.