4. Google Web Analytics Basics
At the mention of web analytics, the most prominent analytical tool that comes to mind is Google Analytics. Even if you have never ventured into the analytics field or pondered over what it is all about, you must have heard about this amazing service offered by web giant, Google, free!
 Yes, Google Analytics is Google’s very own website assessment service that generates highly detailed statistics about the performance of a website at different points in time. Google Analytics is used by 87% of Analytic Agencies who provide professional web trafficking services to businesses. Owing to the many features of Google Analytics, many webmasters use this service exclusively, without feeling the need to explore other web based analytical tools.
Perhaps the biggest advantage of using Google Analytics is that the services from this tool can be combined with other similar web assessment services by Google (such as Google AdWords and Google Search Console), making a highly comprehensive and insightful analysis. Such an ‘inside’ assessment of a website can prove to be very beneficial for the business, because problem areas can be pinpointed easily – and that too with a lot of evidence.
Google Analytics is not only used by IT specialists to tweak a website’s design and layout. Instead, with the many innovative features of this tool, marketers and SEO specialists alike are also using Google Analytics to assess the success of promotional campaigns, the changes to make in them and to pave a way forward for online marketing to yield results.
Some of the most notable features of Google Analytics that are widely used by webmasters include:
- User segmentation
- Custom dashboard
- E-commerce reporting (transactions, revenue and sales activity)
- Funnel visualization
- AdWords and optimizing campaigns
Installing Google Analytics
Step 1: Sign up
To start using Google Analytics and make sure of its advanced features, you need to have a Google Account. This link: https://accounts.google.com/NewAccount will direct you to the specific page that will help you create Google Account.
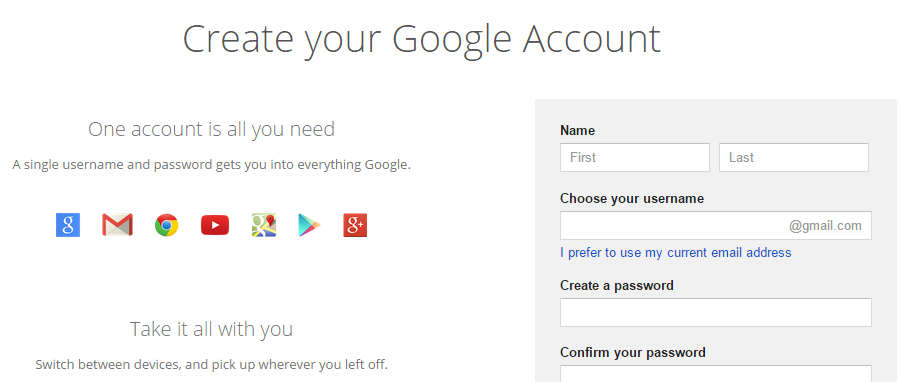 Since Google Analytics is a free tool available for anyone on the internet to use, once you are logged in to the Google account, you can easily access Google Analytics from the ‘Products’ section on the left.
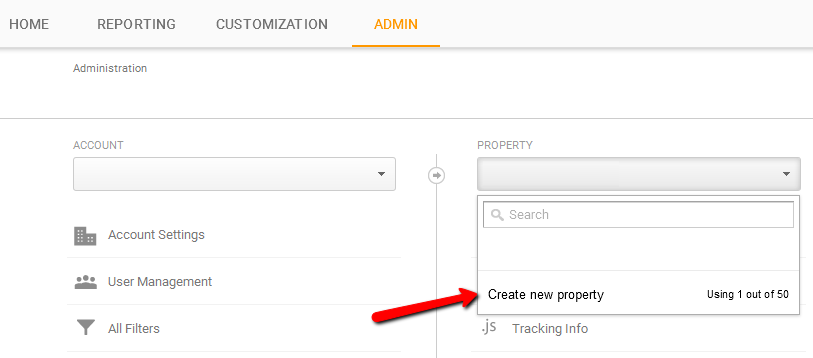
Step 2: Set account properties
Setting account properties is necessary because it affects how information and data will be viewed on your screen. Google Analytics is a user-friendly tool, which is why there is a lot of flexibility when configuring your account and deciding how to view data and graphs.
Go to the Admin tab of the Google Analytics account and click on ‘Create New Property’.
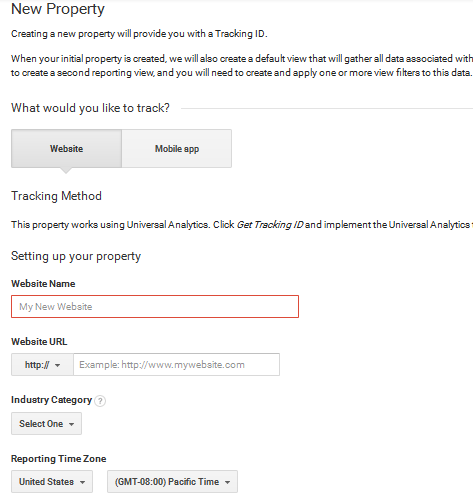
 You will be asked the information about the website such as website name and URL. At this stage, you can also decide whether you want Google Analytics to be available as a mobile app or not. You should make sure that you choose the correct time zone, as it will be used in the reports.
Step 3: Set up tracking code
To collect information and insights about your website, Google Analytics requires a tracking code to be embedded in the website/webpage to be tracked. When you add the website to be tracked in Google Analytics, the system generates a code that you will add to the selected pages.
Every such code has a unique ID, which is used to deliver information about a website to the user’s Google Analytics account. From here, reports about the website’s performance are presented to the webmaster for informed decision-making. The current version of the Google Analytics tracking code, Asynchronous Tracking Code, is highly sensitive and records even the shortest activity on a website.
Setting up
So you now have a Google Analytics account, you have the tracking code in hand and you have started loving the look of Google Analytics. What is next? Even though data is recorded, and transferred to the reports, and charts on a regular basis, there are a number of things you need to set up before you can analyze the data and analyze the performance of the website.
Once data comes in and it is represented on reports and trend analysis figures, it becomes hard to change settings and configurations when you realize this is not how you want to view the results. Therefore, putting enough time and effort to set up the many Google Analytics variables is sensible because it saves up on a lot of trouble later on.
Moreover, the information under question is very crucial. A website’s lifespan and a business’s success depend on the results derived from this data; hence, it is important to view it just right and make the most of it by extracting conclusions and deductions that will make sense.
To complete these settings, it is necessary for you to answer a few questions beforehand. For instance:
- How do you want the data to be segmented as soon as it is ready for analysis?
- Which charts and graphs should it be divided amongst?
- Will all segments be part of your consideration?
The answers to these questions dictate the efficacy of Google Analytics for your website and the data coming in.
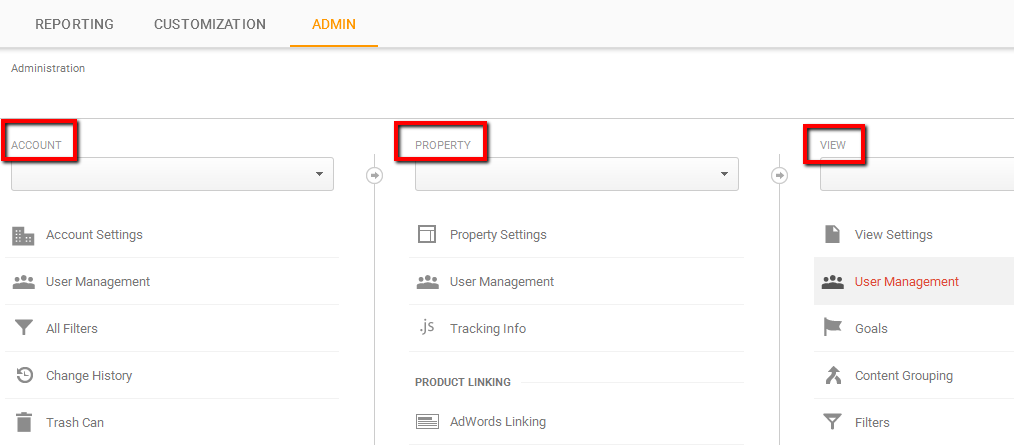
Account, property and view
Before you start, you should understand the hierarch of the Google Analytics account.
- Account – This is the account you are using, with the possibility to manage the account and access the account settings.
- Property – Properties in your account are the properties you want to collect the data for. It is usually a website.
- View – A view is a part of the property you want to closely examine. For example, you can set up different views to track different areas of the website, such as home page, or any external page, traffic from the AdWords, etc.
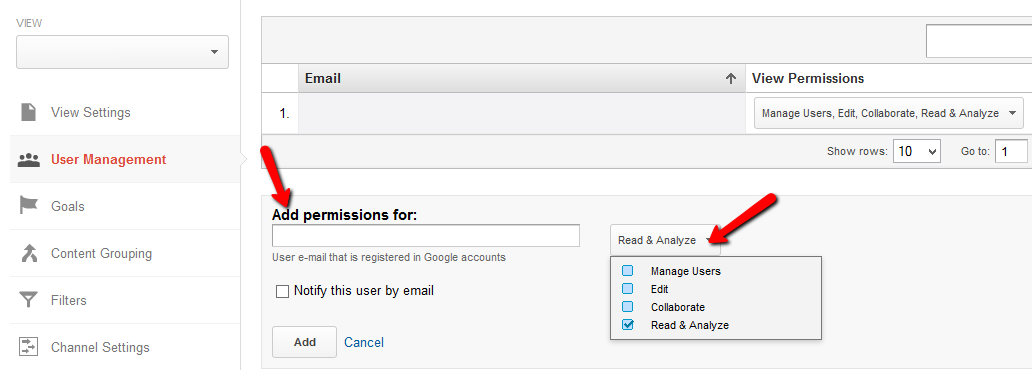
Profiles (users) and filters
Profiles and filters are highly useful functions. Multiple profiles, also called views, can be set up by the administration running Google Analytics to limit the information that is viewed by different departments.
For instance, a limited profile can be set up for the sales department, while accounts and marketing get to view the detailed versions. This is done by assigning custom permissions for each profile.
 Filters, on the other hand, are used to segment data coming in. Filters are applied to data before it is extracted, therefore, they change the way you will see the incoming information on your dashboard. Depending on which filters you prioritize, data will be organized in a particular pattern to make it convenient for the viewer to analyze.
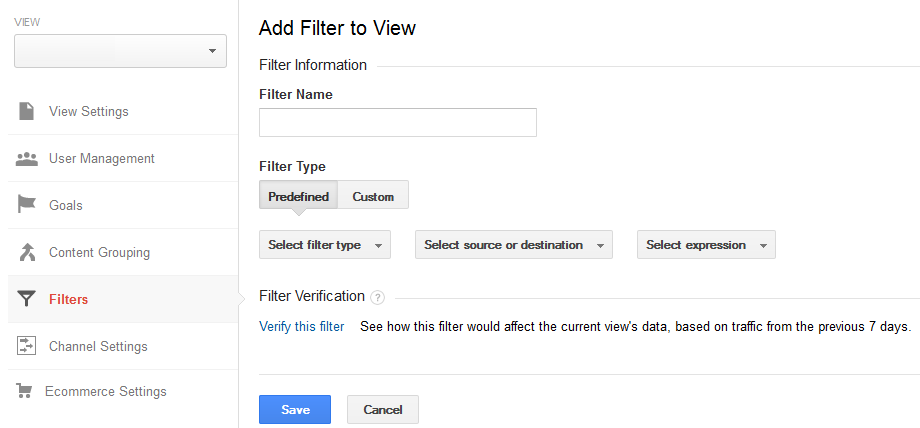
It is important to select filters very carefully because:
- They are used to collect information on specific traffic channels, for example, paid vs. organic channels.
- They put a certain part of your website in the spotlight. For example, your focus can be to only analyze the blogs on the webpage.
- They separate data coming from different domains. For example, data collected from .com and .org.
- They separate data from different sub-domains.
Types of filters:
- Traffic from IP Addresses – This is applied to the traffic visiting a website from a range of IP addresses only.
- Traffic from Domains – This is applied to traffic visiting from a certain domain only.
- Traffic from Sub-directories – This is applied to a particular directory on the website like a blog.
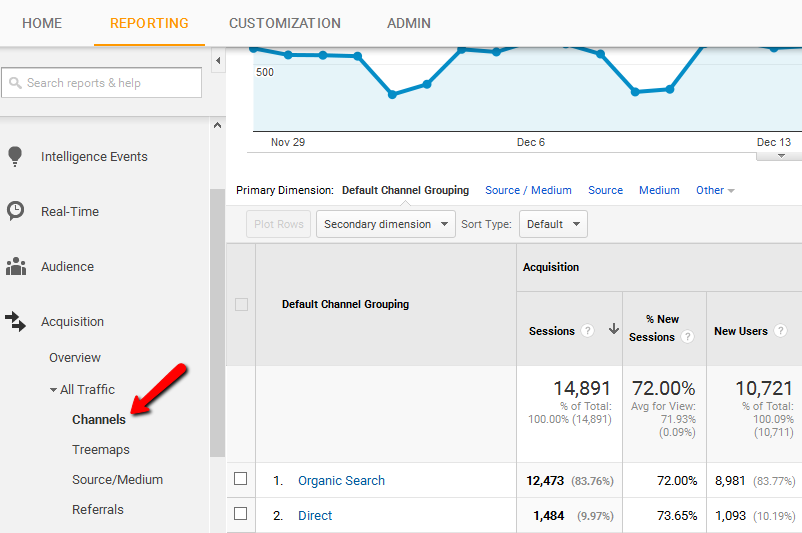
Tracking traffic channels
Tracking the sources of traffic is very important in web analytics. For a webmaster to know where visitors are coming from and which sources on the internet direct the most traffic to the website, this tracking tool should be used at all times.
Traffic is usually divided into paid and organic. Paid traffic comes from sources from online advertising, while organic traffic comes from purely search based sources.
Paid traffic
Since every website is looked up using keywords and phrases, integrating Google AdWords with Google Analytics is the best way to get an insight into the channels used. Paid traffic channels can be distinguished from referrer websites by adding tags in their URL.
Once this distinction is made, the Google Analytics account and AdWords accounts are connected for data to be integrated. Data related to the cost of having paid channels is compared with the response received via this channel.
Organic traffic
Organic traffic is identified by the unlisted keywords used to get to your website. These keywords allow a webmaster to see how effective landing pages were in attracting users to the website. Analyzing organic traffic is very important because it tells a business the keywords that can be incorporated into SEO efforts, those that give returned impressions and the ones that are most relevant to the business’s objectives.
 Google Analytics also offers a SEO Report feature that can be set up to keep a record of SEO efforts, the keywords that are part of it and the improvements that can be made to this selection of keywords. The best way to make use of organic traffic is to integrate Search Console with your Google Analytics account.
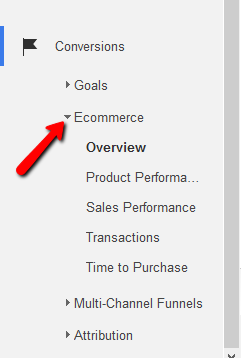
E-commerce tracking
One of the biggest chunks of Google Analytic users are those running e-commerce websites. Since online shopping has become popular in the 21st century, there is tough competition among e-commerce websites all of whom are constantly trying to appease buyers and turn leads into customers.
For such websites, the e-commerce function of Google Analytics is very useful. Website owners can set up this feature to track sales activity and performance. To organize the information gathered from this tracking function, Google Analytics puts together an e-commerce report that represents the following:
- The number of transactions
- Revenue earned
- The kind of products people bought online
- The number of times people visited the store
- And finally, the e-commerce conversion rate
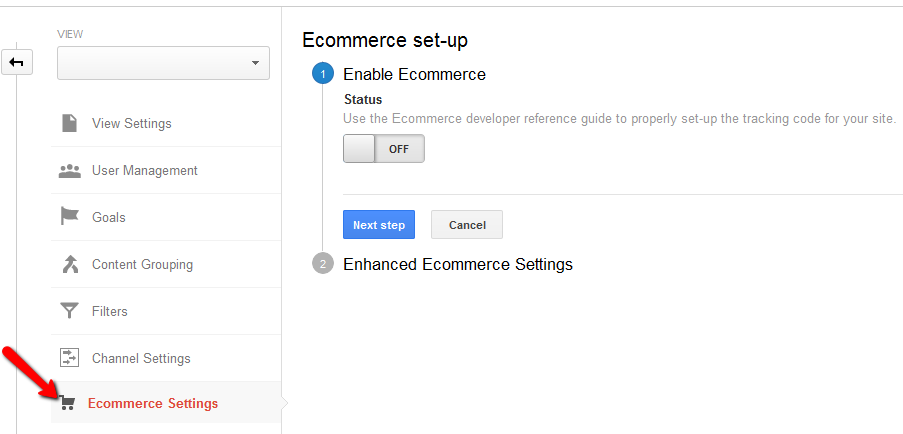
 To enable e-commerce tracking, all you have to do is enable e-commerce function and choose the settings inside the view.
 E-commerce tracking on your website is not all the Google Analytics account is capable of. If your website is one of those that connect different domains or sub-domains during the checkout procedure, Google Analytics takes care of this as well. With the addition of more codes, the program lets you track activities on multiple domains.
Doing so generates valuable data regarding conversion because not every customer who accesses the shopping basket of your e-store completes a purchase. What made him back out? Why did he leave? Will he return to complete the transaction? These are some questions, that can be answered, once the data is collected from all domains and put together in a meaningful manner.
On-site search tracking
An important visitor behavior to take into account is online traffic searches for items and links on your website after landing on it. On-site search is one of the most important features of a website because many visitors prefer to look for the item you want and whizz through to checkout.
However, the level of customer frustration is very high when the on-site search function does not work. This may even be the reason why a visitor left the website mid-way. To understand such a reason, it is essential for you to conduct on-site search tracking.
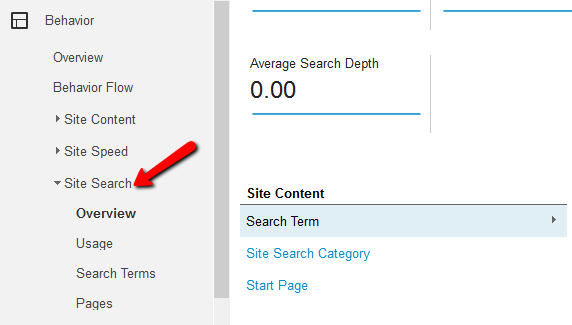 The internal search tracking feature lets website owners analyze the products visitors search for the most, the pages they search on, where they begin the search and where they end it and finally, if search resulted in successful conversions.
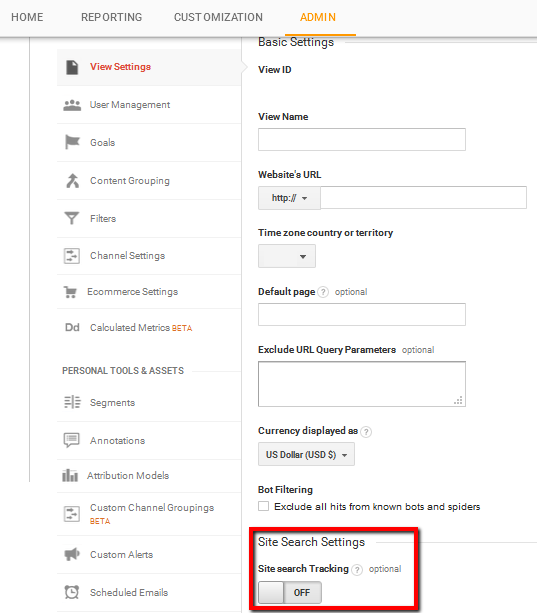
To enable on-site search tracking, you will have to go to ‘View’ and then in ‘View settings’ to select this search option. Remember, Google Analytics reports for on-site search tracking use the word ‘Search Term’ to refer to internal searching.
On-page interaction tracking
How are visitors interacting on your pages? Interactions are activities done by users when they find something interesting on your website. Interactions like going from one page to the other are recorded by metrics like page views. However, there are many other actions performed on a website, which do not result in additional page views.
How can these interactions be measured? Google Analytics has a number of features that can be used to track on-page interactions that come under one of the following categories.
Virtual page views
As the name suggests, a virtual page view is used to record an interaction that has not really generated a page view or requested a new page download. This option can be used to record any kind of interaction that has taken place on the website without going from one page to the other.
Virtual page views are an essential tool because most websites have options for flash players, downloadable images, pop-ups, iFrames and flash video that are classified under interactions, and yet do not generate new page views. To record these activities, virtual page views are used.
Google Analytics reports display page views in the same category as virtual page views. To separate both results, a new view can be created.
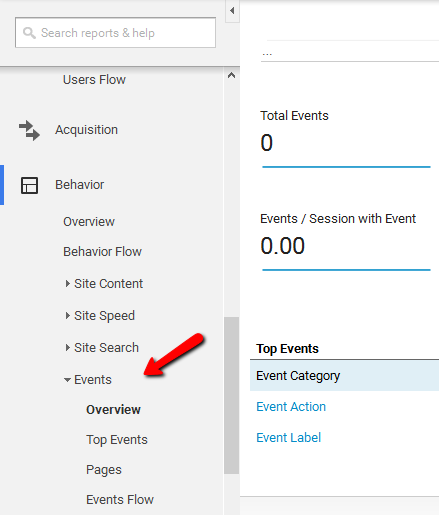
Event tracking
Another way to track activities that do not generate page views is by event tracking. This method is useful for interactions like:
- Call-to-action buttons
- Video players
- Advertisement clicks
- Internal links clicks
Event tracking is a very accurate metric because it does not inflate the page count for a website. This means that the pages that were actually viewed stays separate from the other interactions that did not involve new pages. Being a frequently used tool, Google Analytics enables users to categorize and organize events by labeling them and assigning values as well.
On-page interactions that are monitored using event tracking are then divided into various categories, making it easier for webmasters and analysts to identify the type of interaction at a future date.
Goal tracking
Goal tracking is the essence of converting visitors into customers. With this feature, Google Analytics enables website owners to gauge the efficacy of their call to action buttons and signs. Every website has a final objective that it aims to achieve. To reach this final objective of sales revenue, many smaller objectives and goals are first targeted. For some, minor goals may be newsletter subscriptions, while for others it may be sharing web content on the social media.
Either way, these actions need to be tracked because they are inputs for conversion rates calculated by Google Analytics. The frequency with which customers are reaching these goals is an important indicator of what more can be done to help visitors to convert easily.
By setting up goal tracking, small actions taken on a website can be recorded and analyzed.
Go to the ‘View’ in the ‘Admin’ tab to create new goals. Have in mind that you are allowed to create up to 20 goals per view.
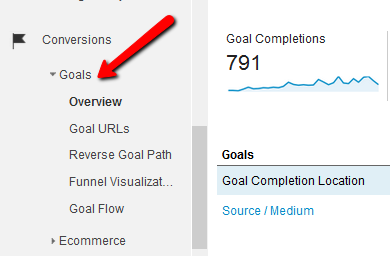
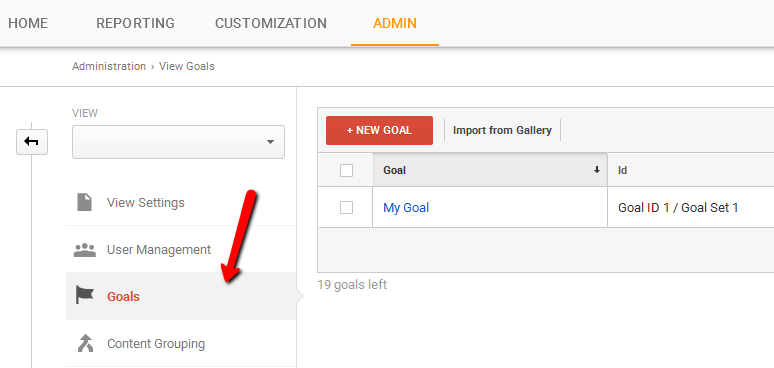 Once you have set up your goals, you will be able to track the performance of the goal from the ‘Reporting’ tab of the account.
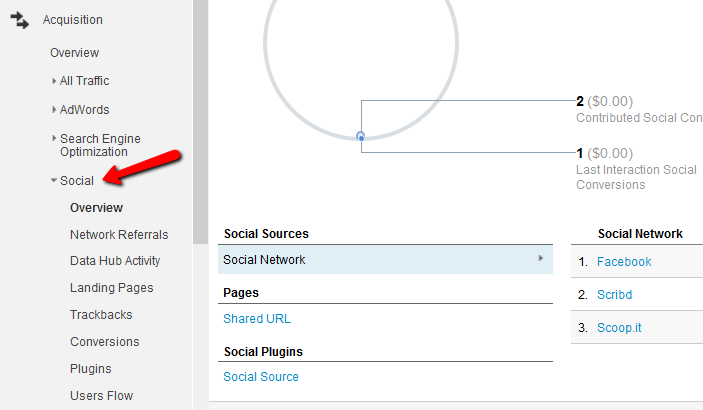
Social media integration
The social media report displays the results of the activities and interactions on social pages that you have listed. The traffic sources report has a detailed section for social data in which details about the revenue earned via social media, visit durations on different forums like Facebook and Twitter and the number of pages viewed are recorded.
Because of the immense popularity of social media, a website is usually integrated with social forums so that a visitor is direct by and forth between both sources. To measure and keep an eye on which social sources are being viewed the most and why, social media reports are an essential tool used.
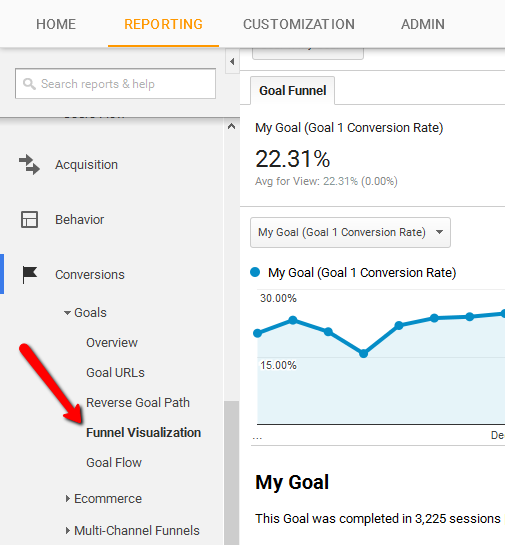
Goal funnel visualization
A funnel is the series of steps a visitor takes to get to the end of the conversion cycle. The goal funnel visualization lets website owners define a funnel for every URL destination goal. An analysis of the funnel is a great starting point for eliminating potential hurdles because of which visitors leave the website before reaching the conversion page.
Hence, this feature makes it possible to assign a particular goal with a predefined funnel path so that conversion dropouts can be assessed easily.
Analyzing data through Google Analytics
Now that you have set up Google Analytics, explored the various features in it and understood how to use those to gather insights, it is now time to start making sense of the data gathered. On their own, analytics data often do not make much sense, but when the same is put together with a lot of other information, compared and contrasted with existing and benchmark levels, a new picture starts to form.
There are many analysis features in the Google Analytics account that make it easy for webmasters to understand and assess how well a website is performing, and what more can be done to up its ranking. These tools gather in-depth information from a business’s website, transfer it to the Google Analytics software and then present it in a comparable form that is easy to read.
The six most useful Google Analytics features for data analysis are:
Advanced segments
Using advanced segments, webmasters can analyze a specific segment of the population that visits a website in isolation. This tool works as a filter to assess the behavior, reaction and response of one kind of customer segment or traffic that may have visited your web page. For instance, if you want to analyze the segment of the traffic that actually purchased something from your e-store, the number of these visitors can be isolated and then compared to the total visitors who landed on the page.
Advanced segments feature is a custom feature, meaning, every business owner using Google Analytics can create segments that are the most relevant to the website.
Google Analytics gives users the option to apply:
- All sessions segment – Applies to all reports and displays all data gathered.
- Single segment – Represents one sub set and information about it.
- Multiple segments – Lets you compare two sub sets of the traffic under question.
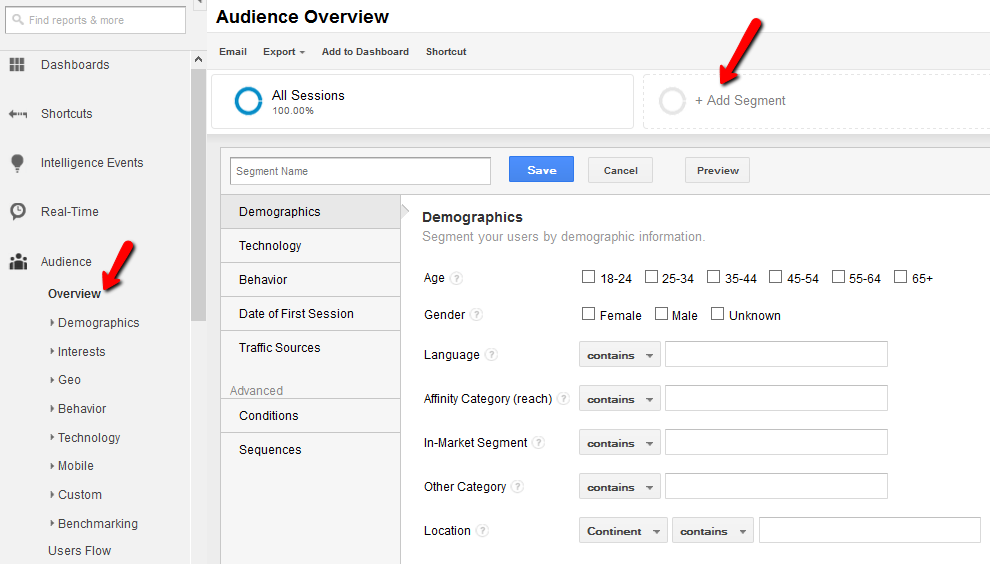
In order to create custom segments, go to the ‘Audience Overview’ and click on the option ‘+Add Segment’. You will be able to choose different settings in order to create an advanced segment you want to track through Google Analytics.
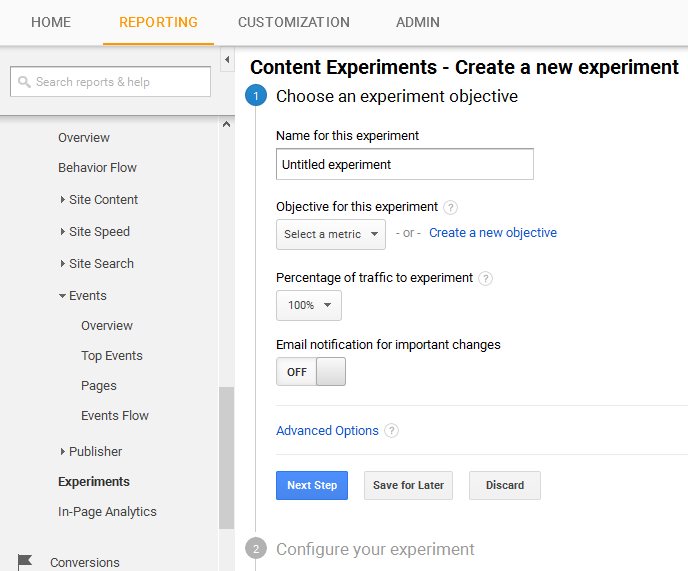
Content experiments
Content experiments feature is another useful feature inside Google Analytics that lets webmasters choose from a variety of website designs and layout. It gives the business owner the power and confidence to design a website in the best possible manner in order to get the most conversions. With this tool, no longer do website designer make guesses about how to display content and on which layout.
For instance, up to 10 variations of a landing page are given by Google Analytics, each of which can be implemented by webmasters to maximize conversion rates. Perhaps the biggest advantage of using content experiments is that it lets business owners post all 10 variations of the landing page simultaneously via ten different URLs! Hence, taking web analytics to a whole new level.
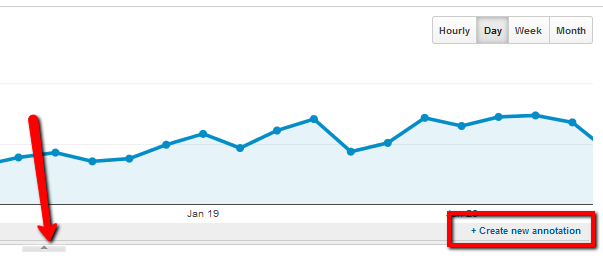
Annotations
Annotation is reporting feature that is very useful for webmasters while assessing data gathered from website usage. Using this tool, those conducting assessment and analyzes can make notes on graphs and pie charts to pinpoint anomalies and unusual occurrences.
Since analysis reports are shared, and analyzed by multiple people at the same time or even at different points in time, annotations promote sharing notes and knowledge regarding the analysis being conducted. This way, the team of web analysts is able to arrive at unanimous conclusions about a website’s performance.
Use the arrow below the charts to access the annotations or to create a new one.
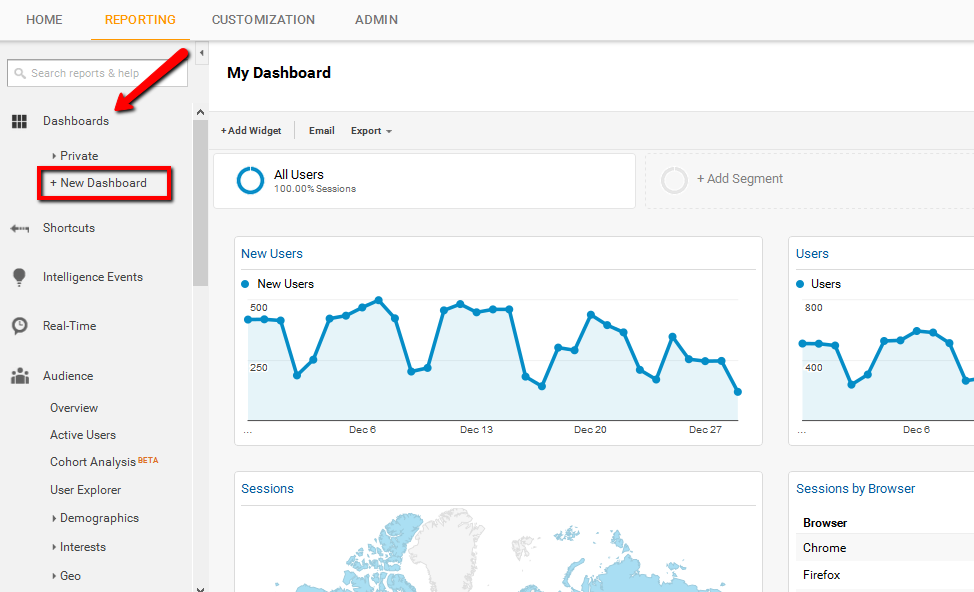
Dashboards
The best way to conduct a detailed website analysis, and yet only go through the most important details, is by viewing a dashboard. A dashboard is like a snapshot of the most viewed metrics and the most important trends that a webmaster needs to view as soon as he signs into his account. Therefore, it represents a collection of widgets enabling a user to see a quick overview of reports and assessments for decision-making.
Within this collection, a number of metrics can be stored, analyzed and contrasted because important decisions are based on them. Google Analytics dashboards can be completed customized and easily managed.
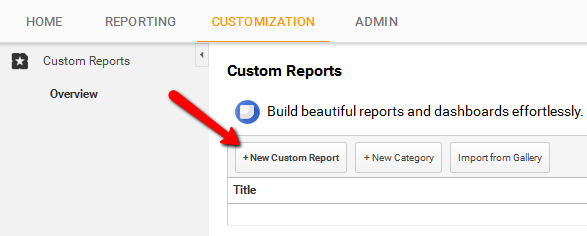
Custom reports
With custom reports, all users of Google Analytics can make their very own reports in order to assess the performance of a website. Analysts can chose which metrics to represent, which dimensions to use, and how to display all the information and data. The option to customize all reports enables business owners to make assessment reports highly relevant to their field and industry.
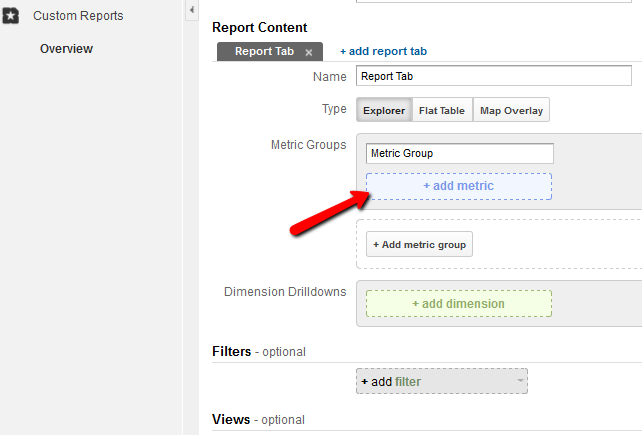 Instead of using predefined formats, custom reporting lets users give new and varied directions to web analytics so that new solutions can be derived from existing data samples. The option for creating custom reports can be found under ‘Customization’ tab in the navigation menu of the account.
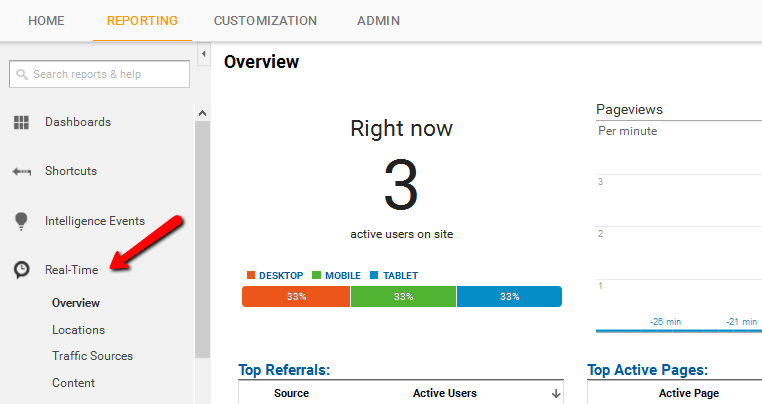
Real-Time reporting
Ever wished you could witness what visitors are doing on your website this very moment? The Real time reporting option inside Google Analytics account lets you do just that. Real time reporting allows webmasters to monitor what happens on the website as and when it happens. It gives owners a chance to view which content is more popular, how visitors reacted to it, and the times that the website is most viewed.
Such a feature is one of the biggest strengths of Google Analytics because it moves away from many other traditional analytic tools that record and then report. The opportunity to witness action in real time reduces the time between the activities and the corrective measures taken to fix problem areas.
With real time reporting, analysis reports are updated every few seconds as more and more hits are recorded. When using this feature, you can get hold of the following information:
- The number of people on your website at that particular point in time
- The pages or events they are viewing
- The geographic locations they belong to
- The sources of traffic through which they were referred
- The kind of conversion that has taken place, if any