
3. Using Web Analytics
Web analytics basics
Web analytics is an important tool for success today. It is one of the most widely used drivers of long-term business growth, since web analytics helps business leaders and owners by pointing out problem areas that can be improved to accelerate lead conversion.
Moreover, analysing your website and other online platforms enables a business to stay up-to-date with the passing trends and requirements customers have. Doing so is the best way to stay abreast with tough competition in the market, because a modern customer has many options today; if your website fails to attract the visitors, they will take their business elsewhere.
To prevent client leaving, web analytics is widely practiced today as a mandatory exercise that gives a sneak peek into the performance of the website from time to time. With this idea in mind, it makes sense to initiate the web analytics process with the most important link in the conversion chain, i.e. the customer.
Since analytics involves promotional improvement as well as alterations to website design, customers are the most appropriate starting point, as they can provide insights to a business regarding the problems they face while exploring a website, the changes they would want introduced and the way these changes can result in higher conversations.
Therefore, when thinking whether to invest in web analytics or not, ask yourself the following questions:
- Do you conduct business via your official website?
- Is your conversion rate very low?
- Do you want to invest in redesigning the website?
- Do you market your business online?
Hence, there are two main elements in any web analytics process.
- The first is the analytic software that generates data; and
- The second is the human component, i.e. the analyst who shifts and sorts this data for it to make sense.
Consequently, there is a lot to know and understand about this process, its jargons, metrics and many elements that are used to generate results.
The five ‘Whs’ of web analytics
The most basic use of web analytics generates information that can be used by experts in the industry to determine how customers perceive a business’ website. Since this process aims to yield information that a business can use to improve its services and change more leads into sales, all the data gathered from analysing a website is related to the customer and his activities, in one way or the other.
To explain the process of analytics and give readers a basic idea about its usage, we will divide it into five main elements. Each of these is an important link in the analytics chain, as those elements combine together provide information about website’s overall performance and influence.
1) Who
The ‘Who’ in web analytics will tell you about the visitors to your website or page. It informs you regarding who lands on your website; or in other words, what kind of traffic your webpage attracts. This information is highly meaningful because it tells the business owner or analyst the markets in which the website is most used. Some of the most important data generated in this category is the location of the visitors, the ISP they use and the authentication that the visitors are humans.
2) What
This category tells you what the customer did on the website. Knowing the aspects of your online presence that attract the most attention is important for making improvements to the website. Data generated regarding the ‘What’, includes; how long the customer stayed on your website, what images and files he viewed, the links he opened and the browser used to navigate your website.
3) Where
The ‘Where’ element tells you from which source the visitor landed on your page. For instance, did he use Google or Bing? Was he referred by an affiliate marketing campaign or link partners? All these sources are collectively called Site Referrers. Data gathered in this category is strategic, because it helps a business point out sources that are the most effective in generating traffic.
4) Why
Information about ‘Why’ the visitors landed on your page includes the cues that drew them to your website. Was it a keyword or key phrase? Or was it a particular backlink that led them to your page? This data helps businesses understand what customers are looking for on the World Wide Web.
5) When
‘When’ tells you at what time most visitors arrived to your page. This data is broken down into the actual number of new visitors, the pages they viewed, and how long they stayed on each page. Information right down to the exact month, day, hour and time can be recorded. This data is especially important because it guides marketers and business owners while putting up advertisement campaigns.
Most used terms
When implementing web analytics, a number of important terms and concepts need to be kept in mind. These include the following:
- Metrics
Metrics are indices or measurement standards used to gauge the performance of a website. Every web analysis is conducted by using a lot of different metrics, each of which measures and assess a different aspect of a website. On its own, the result of a metric may be indecisive. However, when put together, the results of multiple metrics can give a complete picture of web performance.
- Hits
Hits are also known as impressions. A hit or impression is registered when a user requests a file and your server delivers it. Such a file may be a word document, an image file, a download of content or even a file like JavaScript. If a page with four images is opened by a user, five hits will be registered on the server.
Therefore, hits are recorded for every request, regardless of whether it results in a positive action from the user, like a purchase or a sale. For this reason, many web analyst experts assert that counting the number of hits is not one of the most reliable ways to gauge the performance of a website.
- User sessions
A single user session is classified as the time the user took to browse a website in one go. By ‘one go’, it means that for the visit to count as a session, the activities performed have to be completed in a specified period of time. On average, one visit is determined by 30 clicks in 30 minutes.
- Page tracking
Page tracking is a very important metric because it tells you the number of views one particular page had in a predefined timeframe. This allows you to assess the performance of the content on that page.
- Page tagging
Page tagging helps web analysts determine the number of views a single page gets. For this metric, experts categorize a number of pages together in a group form to make it easy for them to be tracked.
There are plenty of other terms, that are frequently used in web analytics. These will be discussed in the later chapters of this book to promote a better understanding of the concepts of web analytics.
How to choose a web analytic tool?
Why you should use web analytics is no more a question that begs for a compelling answer. One look around you and you will suddenly realize the competition your website faces on the internet. The amount of clutter on this virtual realm is beyond belief, which is why standing out from a hundred others is such a top priority for a successful business.
However, the field of web analytics is vast. There are many tools that a business owner can choose from, in order to determine how well the website is doing online. Each of these tools delivers different answers and helps in different ways to analyze a particular aspect of web design, content, promotion and strategy.
Therefore, which ones of these you pick depends on your need to analyze your website. The following are some basic criteria to compare various analytical tools available for use.
- The need
The analytical tool you pick mostly depends on the need for analysis. Why do you want to make web analytics a part of your monitoring process? What purpose do you want analytical tools to achieve? Once you identify the need, picking a tool becomes easy.
- The features
What features does a particular tool have? While each tool is under the same umbrella term of analytics, the features and functions of each differ drastically. Again, this criterion links strongly to the need you have. If, for instance, you want to redesign your website, your focus will be on a tool with features enabling you to assess the user-friendly nature of the website.
- The cost
Not all analytical tools are available for free. While some can be downloaded online at nil costs, other have to be purchased after the trial period is over. Overall, web analytics is not a cost-free exercise. Apart from choosing the right tool, there are costs related to infrastructure changes, implementation and generating, and deciphering results from the data.
- Ability to integrate
How well does a tool integrate with other performance metrics? A web analytical tool needs input from various measurements, and its output further becomes an input for other indicators. Therefore, it is highly important that the tools you choose integrate well with your overall performance strategy.
- Supplier reliability
This is also an essential factor because many analytical tools are designed by suppliers who cannot be trusted. You should only purchase a tool that has been put together by a reliable supplier.
- Language and documentation support
Every tool has a particular language and style in which data is generated and results are analysed. The tool you choose should have language and text support so that results can be understood by the analytical expert you have assigned for the task. Without this support, no amount of data will make any sense.
Top 7 web analytic tools
While deciding between the hundreds of web analytical tools now available; a webmaster will be faced with a tough choice because each is as competitive as the other. Aside from Google Analytics, which has remained a top contender in all business circles, website owners choose at least two to three analytical tools that are used in conjunction with Google Analytics to arrive at highly comprehensive results.
Since Google Analytics is the most detailed and yes, the most popular tool that is available for free, we have dedicated a separate chapter to discuss it at great length. The following is a list of the top eight analytical tools that can be used along with Google Analytics to measure the performance of a business website with multiple metrics.
1) Woopra
Woopra is a desktop application that does a great analytics job for a website. One of its strongest points is real time tracking, through which the application records website activities as and when they happen. With the help of basic and advanced web analytics tools, Woopra is a reliable option to gauge the performance of a website and pinpoint problem areas.
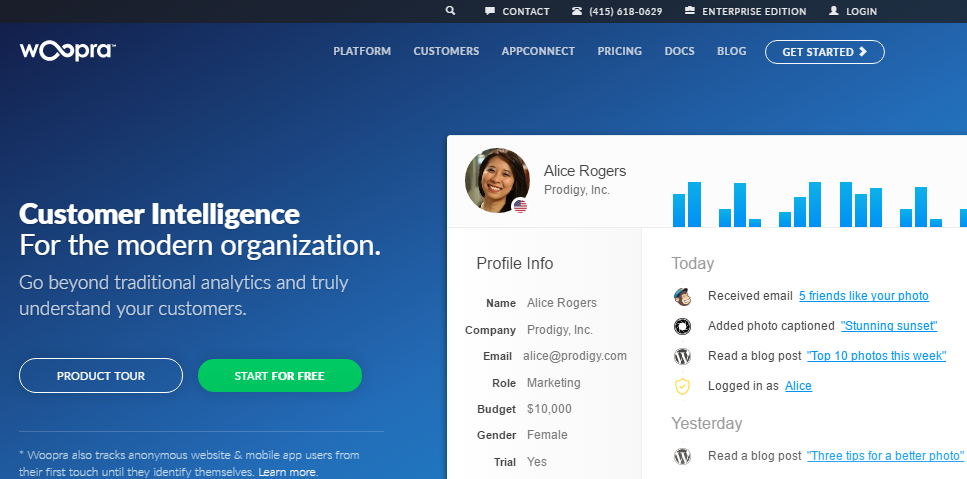
Woopra renders information related to:
- Stats about number of visits and visitors
- Information related to the source, web browser used, geographic location and referring website
- Activities performed on the website
A live chat option makes this paid service a great way to track e-commerce success.
2) Spring MetricsSpring Metrics is a very simple analytical tool for beginners. It tracks a visitor’s path right from the time he lands on the website, until the visitor leaves it from a certain page. Some of the most useful features of this tool are:
- Real time analytics
- Keyword assessments
- Email performance reports
- Sources that lead to top conversions
- Point to click configuration
 3) Clicky
Another good choice of an analytical tool is Clicky. A few versions of this tool are available for free if only one website is to be tracked. For multiple websites and advanced features, you will need to subscribe for a pro version.
4) Crazy EggA very innovative feature of this analytical tool is the visualization of what customers and visitors are doing on a website. Using Heatmap Technology, Crazy Egg lets webmasters keep a track of visitors on the basis of each and every click to determine which part of the website they are at and where they are headed.
It goes a step further to give insights like ‘where visitors are keeping their mouse and where they are actually looking.’ Such in-depth analysis makes a very compelling argument when deciding which areas of a website catch the most attention and interaction.
Crazy Egg gives its users a free 30-day trial, after which it charges $9 per 10 active pages for a basic plan. Larger website would probably need one of the more advanced payment plans, which come with more active pages and multiple users.
5) KissmetricsAnother analytical tool that is being used by website owners, who want to watch even the smallest action and movement of the visitors, is called Kissmetrics.
Kissmetrics is ideal for event tracking. It details information of visitor activity in the form of a timeline, which makes it very easy for analysts to understand and decipher. The timeline view identifies patterns and pinpoints changes and trends in movements over time. This feature is a very unique way of displaying the various events that a visitor goes through in a single session.
Kissmetrics is available for free during a 14-day trial period, after which the service has to be purchased. The payment plans start at $220 a month.
6) UserTestingUserTesting takes web analytics to a whole new level. It operates on the premise that the responses of visitors to a website should be recorded on video instead of simply displayed via stats and straight lines. Users of this tool pay for a group of participants to perform activities on their website. These activities are recorded and the website owner is given feedback.

Once this feedback is received, decisions and conclusion can be drawn based on the evidence from the videos in which the visitors’ thoughts can actually be heard. This feedback is actually based on the opinion of members of expert research team, which create the presentation and identify key findings. Basic plan is $99 per video, while pro plan offers customized pricing.
7) Mouseflow
Mouseflow combines various technologies to give users a very detailed and comprehensive analysis. It allows webmasters to view heat maps from different time periods showing user activity. This gives a very clear picture of how visitors react to the many changes made to a website to increase conversion rates.

Moreover, videographing the visitors is another service available that records the activities and session durations of web traffic to analyze every mouse click, scroll and keystroke. Therefore, this tool is a cross between Crazy Egg and User Testing. For a single website and up to 500 pageviews per month, Mouseflow services are available for free.
The analytical tools discussed above are only a few from a list that goes on and on for pages! Owing to the ease of availability of the internet, hundreds of analytical tools have been designed keeping in mind the various unique needs of every business. Choosing one that is the most suitable for your business is then a decision best made by those conducting the analysis.
Web analytic software
Web analytic software is complete web solution that provides a foundation for analysis tools to run and operate.
Having an efficient web analytics software in place, is very important because without such software, it would be impossible to develop a roadmap to assess the performance of a website. It is this software that provides support and configuration for all the metrics and tools that are used by an analyst to determine the number of visitors landing on a page, navigating it, interacting on it and finally, recording an action.
There are many types of software, that can be used for web analytics. These fall under the following categories.
Self Hosted Software
1. Free/Open source softwareFree or open source software is issued under a free software license and can be downloaded and customized by anyone using it. Such software is ideal for companies and websites that undergo very rapid development and want to add and omit analytic features on a regular basis.
Most of these software programs are issued under the GNU or GPL, General Public License. This means webmasters and analysts are free to modify it, use it and share it whenever they want. Some of the most popular choices in this category include:
- AWStats
- Crawl Track
- Webalizer
- Piwik
- W3Perl
2. Proprietary softwareUnlike open source software, proprietary software is owned by a company or a group of developers. Also known as closed source software, web analytic programs developed under this umbrella are a licensed product with a legal copyright holder. These cannot be modified or shared.
This software is regularly updated by the developing company to keep abreast with the changing needs of website owners. They run on different types of platforms like PHP, Windows, Linux and JavaScript.
Proprietary web analytic software has to be purchased from authentic dealers.
Hosted Software Hosted software are centrally located on a common server and distributed to users via a subscription plan. Such software is also termed as ‘on-demand software’ because it is available on a delivery model, which necessitates that the program in question should be wanted by the user.
Most of the famous software in this category use cookies to track visitor activities on a website and usually have various versions for mobiles and tablets as well.
The use of any one of the above types depends on the need for performance of the website owner and the depth of analysis required.
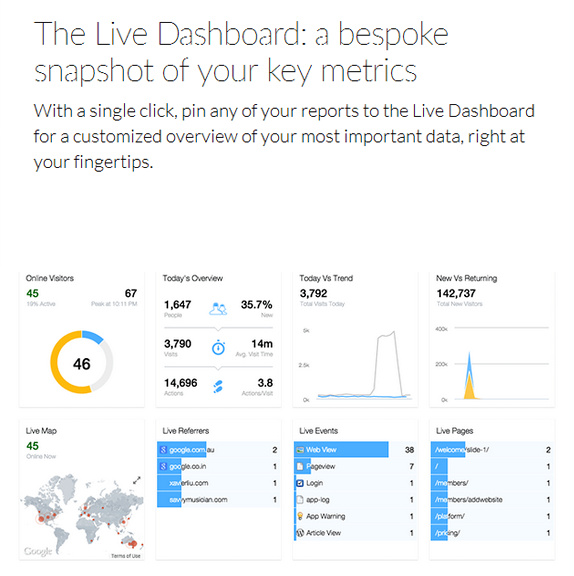
Web analytic dashboard
A single analysis of a website is far too detailed to be studied each time you want to make minor changes to the website’s design or layout. Going over pages and pages of results and analysis is sometimes too time-consuming for an expert or a business owner. How can one take advantage of web analytics in such a situation?
Web analytics dashboard is like a control panel that displays the most important information and data related to your website’s performance. The best way to understand what this dashboard looks like is to picture the control panel of your vehicle. Can you see how the screen displays the essentials like oil level, temperature, speed, and engine condition?
In the same way, a web analytics dashboard presents a snapshot of the lengthy analysis conducted using complicated tools. It is like a condensed and summarized report that lets a business representative assess how well the website has been doing.
Most of the web analytics tools have a dashboard, which helps you organize data inside the tool. Here is one example of a dashboard, provided by Woopra.
Why you should use web analytics dashboard?
Web analytics dashboard is a built-in feature in analytical tools and can be accessed by logging in to the software used for assessment. Having such a dashboard to refer to is definitely a big plus because the numbers and results that matter the most to you can be easily kept at hand, without going through lengthy analytical reports.
It lets users:
- Set goals that are to be achieved with the website.
- Track progress on a daily, weekly and monthly basis.
- Identify danger signals that can be spotted immediately once the right figures are highlighted.
- Decide on corrective action by isolating the problem areas.
Perhaps the biggest advantage of having a web analytics dashboard is that the reports, numbers, files and data that you want to keep at hand can be highlighted and stored in the dashboard permanently. This way, whenever you log in, you can view these files without rummaging through the menus.
Most highly effective dashboards summarize data in the form of trend charts, graphs and pie charts to make reading and assessment quick and easy. Similarly, other types of visual representations can also be chosen, depending on how the analysis is being done.
Moreover, contingent on the extent of quick analysis needed by an expert, more than one dashboard can also be configured on a single account to help prioritize information.
Which metrics to track?
Just as you can choose from a number of web analytic tools, there are lots of metrics to choose among as well. Metrics are measurements of particular criteria that yield returns, which point towards the performance of a website. There are hundreds of metrics used in the field of web analytics nowadays.
Thanks to the easy availability of technology and many unique challenges businesses face due to changing environments, the development of analytic metrics has never been more accelerated than it is today. Even though an easy option is to use just about every metric designed to track website performance, experts suggest that doing so will be a waste of time and recourses.
Hence, a business should always pick metrics to track after understanding the need and consulting professional web analysts. If a professional is not part of the assessment process, then at best, the business should make note of the most important and key metrics that should be made part of every analysis.
The most basic and widely useful metrics to track are divided into the following four categories:
Visitor metrics
- Unique visitors
Unique Visitors are user agents with a specific IP. One user with one IP is only counted as one visitor, no matter how many times he visits a website. Unique visitors are usually counted within a specific timeframe.
- Page views
The number of website pages that are successfully loaded by a website from the main server represents page views. Hence, a page view is recorded every time a user requests a new page by clicking on it. This metric helps determine what pages were viewed by a user and when. Divided by the number of total users, it gives the average pages viewed by one user.
- Bounce rate
It represents the number of people who visit your website, but leave immediately. This action is completed even before the page is loaded completely.
Content metrics
- Exit pages
The exit page metric simply shows the analyst which pages people exit from. This data is essential for planning marketing and promotional campaigns. Exit pages are directly linked to the bounce rate metric.
- Entrance pages
Just the opposite of exit pages, entrance pages are the indicators of the pages from which visitors enter or start exploring your website.
- Navigation paths
Navigation paths are determined from within your website. These indicate the path that a visitor takes while exploring and navigating your website. Which page did he go to after clicking your URL? Which one did he go to just before he placed the order? Did he leave mid-way because navigation was problematic? Such data is revealed via this metric.
Goal metrics
- Conversion rate
Conversation rate is one of the most important metrics in web analytics. It represents the ratio of the people who take an action, i.e. convert to customers from visitors, after landing on your website. A low conversion rate means that even if you are attracting traffic, your website is unable to generate worthy actions.
- Funnel visualization
Directly linked to conversion rates, funnel visualization helps identify the pages that resulted in a lost opportunity, i.e. the leaks in the conversion process that make a potential customer leave without making a purchase.
Traffic metrics
- Referring sites
Referring sites are those web pages that tell a visitor about your website. These online destinations ‘refer’ your website to visitors. Knowing this metric opens up a lot of opportunities because it tells you the kind of websites that link to your own website and the type of visitors you are getting.
- Direct Traffic
Direct traffic is the opposite of site referrals. This metric reveals the number of people who visit a website directly, without first landing on a referral site.
How to identify site referrers?
Site referrer is an important metric that is available in most high-quality web analytics tools. Since this metric is used to pinpoint all those websites that direct internet traffic to yours, it reveals essential information for business owners to decide where to place their advertisements and URLs.
Referring websites are usually always those that are somehow related to the business and industry you are in. For instance, if you manufacture cooking utensils, your URL will most probably be marketed, i.e. referred, by websites that are in the culinary business.
In a similar way, there would be many websites promoting the link to your website. How can you identify these site referrers? It is very important for you to know these sources because various departments of your organization will find this information valuable. Marketing campaigns can be directed towards site referrers, relationships can be built with them and teamed strategies can also be drafted.
Identifying site referrals is a technical procedure. What really happens is this: analytics experts use a process called Reverse DNS Lookup. Using this method, these experts identify all the IP addresses that were used to visit a website. These IP addresses are then traced back to the names associated with them to identify the sites acting as refers.
Broadly speaking, site referrers are classified under these five types of sources:
- Links from newsgroup – Groups that are directed towards specific conversations may share your link as a referral for users who can benefit from it.
- Direct address books – Businesses can get their addresses and URLs put into address books that are available online. Users can pick the link from the address book and visit the website.
- Links from external pages – Any external page, as discussed in the culinary example above, can be a referrer site for your business. These links are usually related to your business as well.
- Links from search engines – While looking for a particular product; say, cooking utensils, users may come across a link to your website on search engines like Google and Yahoo!
- Unknown origin visits – Unknown origin visits can baffle even the most sophisticated web analytics tools. They cannot be traced by highly complicated programs as well. Visits coming from an unknown origin can be identified as spiders, i.e. automatic activity instead of real humans using the internet. A high number of these visits are a signal that you need to up the performance of your website.
How to identify your audience?
One of the most prominent benefits of web analytics is that it provides an insight into the mind and lifestyle of a business’s audience. When the owner of an athletic sports outlet stands behind the counter looking at his customers, all he knows about them is; one, they are sporty, two, they have the money to spend on sports gear, and three, they would be willing to try new equipment.
Beyond that, not much can be understood about customers from their purchasing pattern or buying behavior in that instance. However, if the same sports shop has an online presence in terms of an e-commerce website, detailed information about the relevant audience can be tracked and mapped with just a few metrics.
Web analytics has the power to give valuable insights about customers, their behaviors, where they come from and how they got to know about your website. Thus, it transforms guesswork into information that can be trusted and used. Identifying target audience is then not as hard as it seems because analysing visiting patterns can reveal significant information about the market that is attracted to your website.
To identify your audience, answering some important questions helps:
- Where do you expect most of your audience to come from?
- Is your website visited frequently by those who click a link in a personal email?
- Were they referred by a website?
- Did they leave your website abruptly or was an action completed?
- What keywords and phrases were used to look for your URL?
- Are visitors being directed to your website from sites that are B2B or B2C?
These questions are very important in helping you identify characteristics of your target market because they pinpoint aspects of their behavior and conduct that would not be known otherwise. For instance, when you run analytical metrics for your B2C website, discovering that the referring sites from where visitors get to know about you as B2B, hints that your business may have an untapped target market.
Similarly, if visitor behavior yields that they visit websites that have a high-tech base, maybe you can add the same technology to your forum. In the same manner, understanding the keywords used to search for your website, tells a business owner what the customers are looking for. Combined with the bounce rate, keyword searches can help a business become more attractive to visitors who might stay longer if their search criterion is fulfilled.
There is tremendous growth opportunity for a business that uses web analytics to identify its visitors and customers because it reveals information that would otherwise be hard to get. Once, you have adequate information about the audience, making changes to a website to increase its efficiency becomes an easy process.
How to identify the most important pages?
The internet has millions of pages with information about any and every topic under the sun. Internet traffic is divided among all these pages, because each receives a certain fraction of the total population. In terms of productivity, though, not all pages on the internet are worth investing in.
Do you know the 80/20 Rule in sales management? According to this rule, 20% of a business’ customers derive 80% of its sales. The same rule can be applied to web analytics and identifying the most important pages to invest in. While you may want to be referred by millions of pages so that you get the maximum hits, it helps to set aside 20% of your pages that will generate 80% of your business.
Similarly, a few pages of your website will be more famous with your market, while a few will hardly be visited. For instance, if you were selling sports gear online, hardly anyone would read the page with your privacy policy. The most visited pages in this situation will be those displaying the products, giving tips about their usage and the pages used for actual purchase.
For most service websites, the ‘About Us’ and ‘Contact Us’ pages are known to be the most important ones because they are visited by internet traffic the most. However, experts draw a line between pages that are driving traffic to your website and those that are merely popular reads.
There is a difference in both, because popularity depends on more than just having interesting and catchy content. It also depends on how long the page is, how easily users land on it and how many product or service options you have on this particular page. Pages that drive traffic are those on which visitors land after running thorough searches because they intended to look for these pages in the first place.
Why is it important to know which pages drive traffic? It is important because having a huge number of visitors is not a worthy metric in itself. How quickly these visitors are converted into customers, is what makes all the difference. Therefore, if a web analytics tool, like Google Analytics, reveals the pages that have the least important content got the most visitors, it also means that you probably have a high bounce rate.
Therefore, analytical tools will help you identify the pages that receive the most traffic. However, it is your job to ensure that visitors do not merely leave these pages in a hurry. Instead, they should be willing to browse for longer and finally make a purchase or record a worthwhile action.
In this regard, content optimization is the best strategy to use, because it engages the audience for a longer period of time, thus increasing the chances of conversion. Moreover, ensuring that none of the pages on your website show errors and broken links is also important. This is because the credibility of a website decreases significantly when a page showing an error in a genuine search.
Web analytics takes into account all these factors and helps identify the most popular pages you should be working on, in order to increase conversion rates drastically.
What are Key Performance Indicators?
Web analytics has evolved as a field over the years. From being a targeted, problem oriented tool, it has come a long way to offer complete and comprehensive strategic solutions for business to not only find solutions to specific problems, but also design an effective, overall online strategy. Instead of just pointing out solutions, sophisticated analytical software can help businesses implement these solutions and measure progress as well.
Key Performance Indicators (KPI) are used in every field of business to ensure that the strategies implemented take the organization a step closer to achieving its goals. KPIs are quantifiable and measurable indices that measure the progress of an organization, a new campaign or a new division of a business in relation to its long-term and short-term goals and strategies.
Perhaps, the biggest advantage of using KPIs is that there is no strict criterion that defines them. The element of flexibility and adaptability is what makes Key Performance Indicators truly useful. The KPIs used for every field of business are different and relevant to the field in question. Hence, performance indicators for web analytics are particular to this field as well.
Making KPIs work for you
The entire web analytics process is meaningless if there are no Key Performance Indicators. Therefore, when experts lay down the guidelines to analyze the performance of a client’s website, deciding which indicators to gauge the results against is one of the most important steps. Picking the wrong KPIs not only skews the analysis, it is of no benefit to the business and has no effect on strategy building either.
Hence, to comprehend what went wrong or what will help you get back on track, the following steps are the most essential ones to incorporate in a web analytics process:
Step 1: Determine the Key Performance Indicators to use
As mentioned before, determining the KPIs is an important step. Web analytics has some very popular and generically used KPIs that are put into practice for most performance judgments. Examples of these have been discussed in previous topics as well, because without KPIs, the process of analysing the performance of a website is incomplete.
Some of the most widely used KPIs are:
- Bounce rate
- Visits/Sessions
- Page views
- Entry & Exit pages
- Unique visitors average time on site
- Percentage of new visits
Nonetheless, according to the function and nature of KPIs, they differ from one website to the other. Depending on the type of online forum you want to track with web analytics, the Key Performance Indicators for each will vary accordingly. Broadly, most websites belong to four categories, with the following specific performance indicators:
- E-Commerce websites – Conversion rates, average order value and visit Value
- Lead generation websites – Traffic concentration, conversion rates, cost per lead
- Content and media websites – Ratio of visits to unique visitor, content depth, new visitor percentage
- Support websites – Repeat visitor percentage, content depth, satisfaction Index
Step 2: Track KPIs to make sure reporting is on the spot
To make sense of the KPIs, it is important that you represent these results in a report that enables experts to compare, contrast, relate and associate the indicators with the benchmarks. Naturally, among the various KPIs you use, some will be more important than others. Hence, it is advisable to isolate the most crucial ones and gauge their results and performance over the long run.
The report you conjure will give you a clear picture of the indicators that drive success for your business, how they perform in different time periods and how they relate to other measures of success and your own goals.
Most web analytical tools have a feature for reporting and drafting trend charts in the dashboards that can be set up quite easily. Once you have such a dashboard, you can choose to make the KPI report your landing page as soon as you log in to the software.
Step 3: Establish baseline and cut-offs for each KPI
Baseline is the current result of a KPI. This can be determined once you have isolated the core metrics and set up a report for daily, weekly or monthly progress. When the results of the metrics are out, plug them in the report, and at the end of the week or month, you see the trend or pattern followed by the KPIs. A baseline gives you a solid reference point to relate to. However, there are many factors to take into account when establishing baselines. These include:
- Seasonal nature of the business
- Extent of marketing and promotion
- The kind of website and the duration of time for which it has been operational
- The amount of data you collect to establish the baseline
- Any other externalities reported
Step 4: Analyze the differences in the cut-off and the KPIs generated on the website
Professional web analytics have industry averages and benchmark data with them to assess the performance of a website. Once baseline statistics have been generated, you can now see how far off these are from the benchmark. For instance, the bounce rate your website records may be extraordinarily high compared to an average of all others in the e-commerce field.
Fixing poor metrics is what web analytics is responsible for. When the differences and variations are identified, the experts can get to work to bridge this gap for the client.
Step 5: Optimize performance with corrective action
Performance of a website can be improved when new strategies are formed after analysing KPIs. With the help of the results generated, a business can change the layout and design of the website, optimize specific pages in terms of SEO elements, take care of code errors and broken links, build liaisons with referrers and even change the services offered to achieve bigger goals.
There is an array of corrective actions that can be taken in this regard. However, all of it depends on how well KPIs are used to generate reliable statistics.