

Over the years, the approach to SEO has changed in order to incorporate new best practices and follow recommendations related to website optimization, which is why marketers need to keep up with the trends in the SEO industry and implement necessary changes. One of the main parts of each SEO strategy is certainly the analysis of the metrics.
There is no way to get real, accountable strategy performance results unless you use different tracking methods to analyze metrics that are essential for successful SEO strategy. Since SEO is such a complex strategy, consisting of many activities geared towards boosting website performance and thus increasing profit, you should use these metrics to analyze the SEO strategy and make sure you are doing your best to leverage the power of SEO.
 Simply provide your website URL and click on “Submit” button to analyze the keyword usage. You can also use the same tool to analyze your competitors’ websites, and compare the way you optimize websites, whether you’re using different or similar strategies. This way, you might even get some new ideas related to keywords.
Since SEO isn’t an exact science, you should never rely on one tool exclusively, regardless the metric you want to analyze, so here are a few other keyword tools you could use:
Simply provide your website URL and click on “Submit” button to analyze the keyword usage. You can also use the same tool to analyze your competitors’ websites, and compare the way you optimize websites, whether you’re using different or similar strategies. This way, you might even get some new ideas related to keywords.
Since SEO isn’t an exact science, you should never rely on one tool exclusively, regardless the metric you want to analyze, so here are a few other keyword tools you could use:
 Most of the websites nowadays face with high percentage of mobile traffic in the analytics data, but not all websites are equipped to handle this type of traffic, which can only mean one thing – losing potential clients and leads. In order to prevent this, make sure you optimize your website for mobile users. Think about mobile users, the way they browse your website from mobile devices, and think how you can make your website faster. All of this will help you stay on top of the game in the online market where the mobile friendly website has a much better chance of being competitive.
 Obviously, your goal when analyzing SEO metrics is to use the average time on page as an indicator of how users perceive your content. Try to prolong the time spent on site by publishing lengthy articles. Make the most out of formatting options and visual content, such as images and videos, to ensure you attract the attention of the users and get them interested in your content. Of course, having quality content that is optimized for the right keywords is also a good way to ensure that your content is in fact shown for related and relevant search queries.
Here is a great article with additional suggestions on how to increase average time on page: 11 Hacks to Increase Visitors’ Average Time Spent on Site
Obviously, your goal when analyzing SEO metrics is to use the average time on page as an indicator of how users perceive your content. Try to prolong the time spent on site by publishing lengthy articles. Make the most out of formatting options and visual content, such as images and videos, to ensure you attract the attention of the users and get them interested in your content. Of course, having quality content that is optimized for the right keywords is also a good way to ensure that your content is in fact shown for related and relevant search queries.
Here is a great article with additional suggestions on how to increase average time on page: 11 Hacks to Increase Visitors’ Average Time Spent on Site
 Indexed pages are basically the pages that were discovered by Google and these are the pages that are then shown in the search engine result pages. Your goal is to have as many pages indexed as possible, and the best way to check the status of your website is to use the Search Console again. This time you need the tab “Google Index” where you can see the total number of indexed pages. Since the tab also features a chart inside a timeline, you’ll be able to see how the indexation changes over the course of time. As a result, you’ll be able to determine the actions that lead to increase or decrease of indexed pages, which can help you improve and optimize this metric.
 Which of these metrics do you think has the most influence on the website positioning? Would you add another SEO metric to the list of SEO metrics to watch? Share your thoughts in the comments below.
1. Keyword ranking – analyze the terms you rank for
Keywords are often considered a core of SEO strategy, as a website is based on the keyword research and optimization methods using those keywords in order to target specific users and rank for particular search queries. Keywords are basically the terms you want your website to be associated with, so when someone searches for that specific term in the search engine, you want your website to show up at the top of the search results page. When it comes to analysis of keywords, you can use a tool to help you analyze the keywords and keyword density on your website. Keyword Density Analyzer is a great tool to help you with this task, as it shows the usage of the keywords and keyword phrases on your website, allowing you to get a clear picture on how the keywords are distributed on your website pages. In fact, you can even sort out the keyword usage for body, heading, links, images, or you can use a combine “All text” view to see overall usage.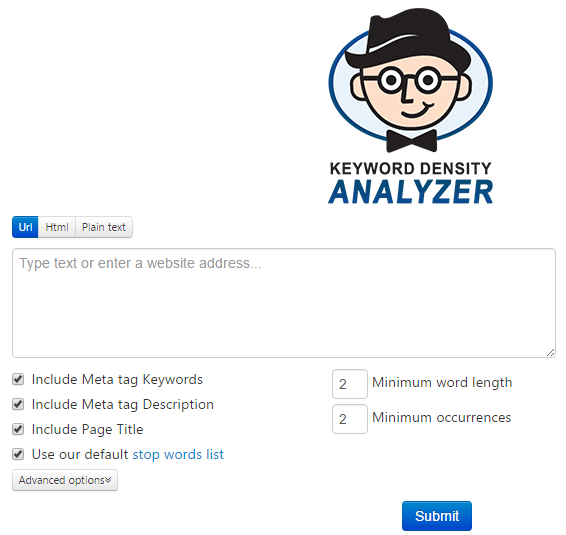 Simply provide your website URL and click on “Submit” button to analyze the keyword usage. You can also use the same tool to analyze your competitors’ websites, and compare the way you optimize websites, whether you’re using different or similar strategies. This way, you might even get some new ideas related to keywords.
Since SEO isn’t an exact science, you should never rely on one tool exclusively, regardless the metric you want to analyze, so here are a few other keyword tools you could use:
Simply provide your website URL and click on “Submit” button to analyze the keyword usage. You can also use the same tool to analyze your competitors’ websites, and compare the way you optimize websites, whether you’re using different or similar strategies. This way, you might even get some new ideas related to keywords.
Since SEO isn’t an exact science, you should never rely on one tool exclusively, regardless the metric you want to analyze, so here are a few other keyword tools you could use:
- Google Keyword Planner (free)
- SEMRush (free and paid)
- WordTracker (paid)
2. Traffic sources – organic vs. paid, desktop vs. mobile
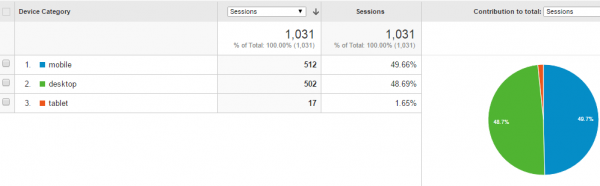
Your next step in the process of analyzing and assessing your SEO strategy is analyzing the metric called traffic sources. This means you need to determine traffic sources in order to see how this affects your SEO in terms of website positioning and website usability. Organic vs. paid The main goal here is to determine whether you’re able to gain visitors through organic search or paid advertising. If you notice that the organic traffic is prevailing, it means that you’re doing a good job with positioning your website, but it may be an indicator that the paid campaign doesn’t give great results and it might need adjusting. On the other hand, if you notice that the percentage of organic traffic is rather low, it means you have to reconsider your SEO strategy and change your approach when it comes to website optimization. You can use this SEO course to learn about the most important aspects of SEO and how you can optimize your website. Apart from assessing the traffic level each source brings, this kind of comparison is also good for analyzing the process of acquiring new customers. Using trackable links and monitoring traffic sources helps you determine whether organic or paid sources bring you conversions, and how this percentage relates to the overall traffic sorted by sources. Consequently, you might choose to focus your efforts on either paid or organic search, as one of those might be a more cost effective solution for your business. Desktop vs. mobile While the main purpose with organic versus paid traffic sources is to define which approach is most efficient and thus could benefit from more investment, comparison of desktop and mobile traffic helps you understand the behavior of your users in order to optimize your website and provide the best user experience. Most of the websites nowadays face with high percentage of mobile traffic in the analytics data, but not all websites are equipped to handle this type of traffic, which can only mean one thing – losing potential clients and leads. In order to prevent this, make sure you optimize your website for mobile users. Think about mobile users, the way they browse your website from mobile devices, and think how you can make your website faster. All of this will help you stay on top of the game in the online market where the mobile friendly website has a much better chance of being competitive.
3. Average time on page / website
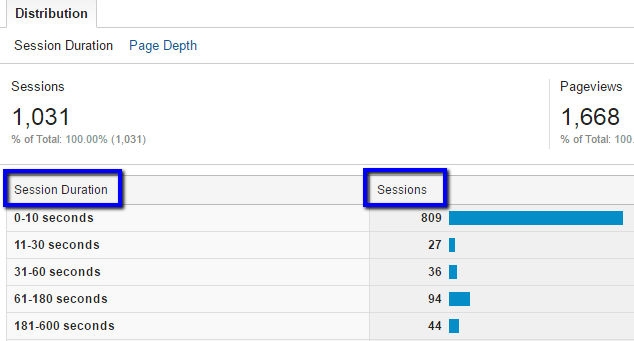
The time users spend on your page is one of the indicators how useful your website is. In the eyes of Google, when a user clicks on the search result and leaves after a few seconds, it means that the page in question doesn’t fulfill the need of the user which is related to the search query. Google uses this process to sort out the pages and filter those that provide true value from those that don’t. Therefore, short time on the page related to a certain search query indicates that the page is either not related to the search query or doesn’t provide the right answer for the user.
Obviously, your goal when analyzing SEO metrics is to use the average time on page as an indicator of how users perceive your content. Try to prolong the time spent on site by publishing lengthy articles. Make the most out of formatting options and visual content, such as images and videos, to ensure you attract the attention of the users and get them interested in your content. Of course, having quality content that is optimized for the right keywords is also a good way to ensure that your content is in fact shown for related and relevant search queries.
Here is a great article with additional suggestions on how to increase average time on page: 11 Hacks to Increase Visitors’ Average Time Spent on Site
4. Pages per visit – engaging or not
Just like average time on page helps you assess the performance of your website, in terms of value the content provides for the users, the number of pages per visit is another metric closely related to website performance, this time in terms of engagement. How does Google evaluate this metric? Well, the reasoning is pretty simple. If the user arrives on your website, but leaves immediately after that, this is an indicator that even though your page might have provided value (due to the longer time spent on the page), you still failed to generate interest of the users in order for them to learn more about your website, by clicking on other pages. The percentage of mobile users also add up to the number of users who have only visited one page, as these users are likely to come through social media. This way, they click on the status update, read the article, and leave the website, thus accounting for only one page viewed per visit. Luckily, there are a few ways to boost your website in order to increase the number of pages viewed per visit, regardless if we talk about mobile or desktop users.- Add CTAs

- Insert “Read more”

- Include related content

- Split content into pages

- Add image gallery


5. Bounce rate and pogo-stick problem
Before you understand how this metric affects SEO and website performance, you have to understand the terms bounce rate and pogo-stick. Bounce rate is the percentage of visitors to a particular website who navigate away from the site after viewing only one page. Pogo-stick in SEO is used to describe a situation when the user is quickly hopping from one search result to another. These two combined are indicators to Google that the user can’t find the answer on the pages viewed in this process, meaning it’s questionable whether those pages should be ranked so high in the search results. Since the main goal of Google is to satisfy users and provide quality answers in the search queries, it’s natural that Google is taking both bounce rate and pogo-stick problem as negative factors. Your goal as a website owner is to try to reduce bounce rate. Let’s be honest, there is no such website with 0% of bounce rate, and it’s perfectly fine to see a larger number as a percentage in your statistics, but what you need to do is to try to reduce it, using different page design, adding call-to-actions, featuring related content, etc. Basically, all tips for increasing engagement and the number of page viewed per visit are applied here as well, as the main idea is to have users click on several pages of your website before they eventually leave the website.6. Page speed and usability
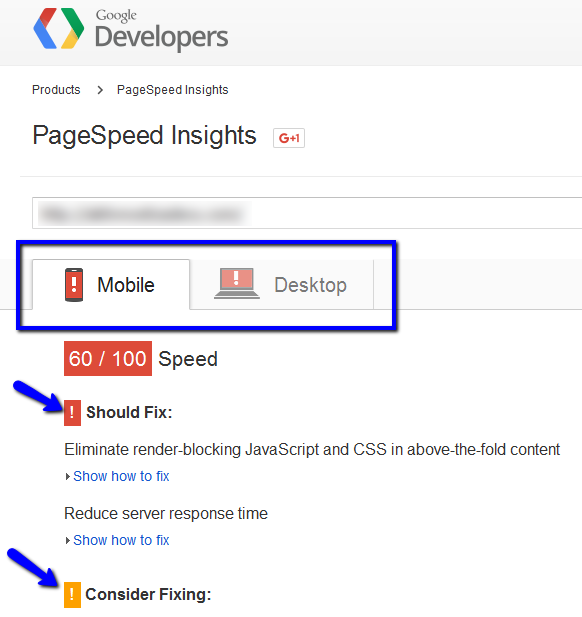
Page speed has never been more important than nowadays. Faster-than-ever internet connection and new gadgets demand websites that load fast and are responsive across all devices. This means that in order to satisfy its users, Google and other search engines have to analyze website page speed and overall usability of the website, as a factor that will help them filter the best pages that meet this new demand. If you want to improve your ranking and help your website position better, you need to analyze this metric and find ways to improve the website performance. A very helpful tool to help you with page speed analysis is Google’s PageSpeed Insights. Common issues are related to optimization of content and the suggestions that will help you improve your website page speed usually include the following:- Reduce server response time
- Optimize images
- Leverage browser caching
- Compression
- Optimize CSS
- Minimize redirects
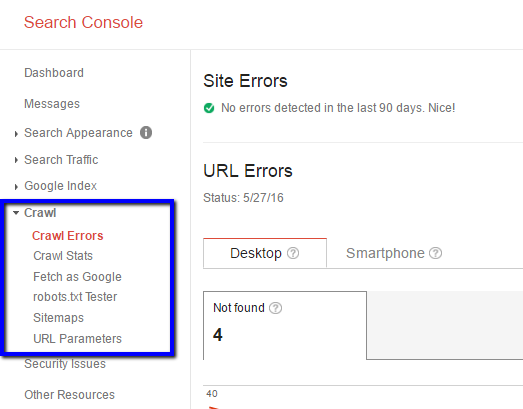
7. Errors and index status
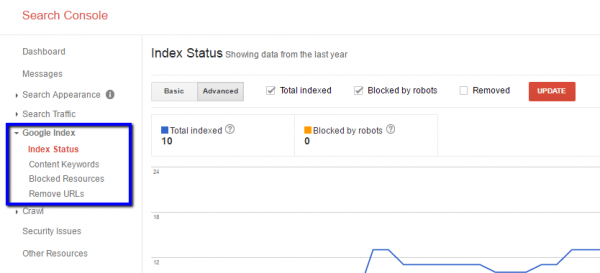
In the purpose of analyzing these metrics, you need the Google’s Search Console (former Webmasters Tools). This tool will help you analyze your website and determine two factors that are closely related to how Google sees your website, and thus affect the positioning of the website. Start by analyzing the errors from the “Crawl Errors” section. Depending on how large your website is (the number of pages on the website), the number here may be quite low or it may be quite high. The greatest benefit is that you can actually download the report with all the URLs of the pages containing crawling errors, which makes it possible for you to go ahead and fix those errors. Indexed pages are basically the pages that were discovered by Google and these are the pages that are then shown in the search engine result pages. Your goal is to have as many pages indexed as possible, and the best way to check the status of your website is to use the Search Console again. This time you need the tab “Google Index” where you can see the total number of indexed pages. Since the tab also features a chart inside a timeline, you’ll be able to see how the indexation changes over the course of time. As a result, you’ll be able to determine the actions that lead to increase or decrease of indexed pages, which can help you improve and optimize this metric.
Which of these metrics do you think has the most influence on the website positioning? Would you add another SEO metric to the list of SEO metrics to watch? Share your thoughts in the comments below.
Indexed pages are basically the pages that were discovered by Google and these are the pages that are then shown in the search engine result pages. Your goal is to have as many pages indexed as possible, and the best way to check the status of your website is to use the Search Console again. This time you need the tab “Google Index” where you can see the total number of indexed pages. Since the tab also features a chart inside a timeline, you’ll be able to see how the indexation changes over the course of time. As a result, you’ll be able to determine the actions that lead to increase or decrease of indexed pages, which can help you improve and optimize this metric.
Which of these metrics do you think has the most influence on the website positioning? Would you add another SEO metric to the list of SEO metrics to watch? Share your thoughts in the comments below.